
The WordPress Analytics Dashboard: See Your Traffic and Conversions Without Leaving WordPress
Posted on · Updated
A WordPress analytics dashboard puts your traffic and conversion numbers on a screen inside your WordPress admin, so you can check them while you're already there working on a post or an order. That saves you the trip to Google Analytics each time (open a tab, pick the property, set the date range), and for a client it's often the difference between looking at their numbers and never looking at all.
For most sites the analytics service behind it is Google Analytics 4, and that's a big part of why a dashboard in WordPress matters at all. GA4 is a powerful engine with a user interface that most site owners can't use.
The Problem With Google Analytics 4
I built websites for clients for a long time before I built plugins, and for most of those years the analytics setup was the same. I'd add Google Analytics, send the client a link, and tell them to have a look. That was the whole handover. The old Universal Analytics interface was simple enough that a business owner could open it, see visits and top pages and where people came from, and get it without any instructions from me.
That stopped being true with GA4. The interface is built around explorations, custom reports, and event-based thinking that makes sense to an analyst and to almost nobody else. There are hour-long video tutorials covering just the basics, which tells you something about a tool that used to need none. I stopped being able to send clients there, because they'd open it, not find anything they recognised, and never go back.
This is also, I think, why the privacy-focused alternatives like Plausible, Fathom, and Pirsch took off when they did. Part of it was privacy, but a lot of it was that their dashboards are one clean page you can understand in a minute. Wanting to use those platforms without losing conversion tracking was one of the reasons I built Conversion Bridge in the first place.
The reality, though, is that GA4 is a strong analytics engine and it's free, so most site owners want to keep using it. What they need is a usable way to look at it. A dashboard inside WordPress can be that, and for a lot of sites it turns GA4 back into something a client can open and understand, which is what the old version had going for it.
Why This Matters for Agencies
If you build sites for clients, you've probably solved "how do I let them see their analytics" more than once since GA4 arrived. The usual answer is a separate reporting tool or a Looker Studio report on top of GA4, which means one more thing to build for every client and one more thing to fix when Google changes something, all to get back the simple view that used to come with the account.
A dashboard inside the client's own WordPress admin gets rid of that layer. The client logs in to the site they already log in to, opens the Analytics menu, and sees sessions, top pages, sources, and the conversions their site produced, on one page, without a second login or a report you maintain. In Conversion Bridge you pick which user roles see that menu, so a client with an editor account can open the dashboard without being given administrator access to the site.
The part that matters for the relationship is the conversions. A client who can see how many leads their site produced last month, and where those leads came from, has proof that the work you did is working, and that makes renewals and the next project a much easier conversation than a traffic graph does.
If you work with clients regularly, Conversion Bridge has an Agency Partner program with a free license so you can try all of this on your own site first.
Bringing Analytics Into the WordPress Admin
A WordPress analytics dashboard doesn't change where your data gets collected. Your analytics service keeps doing that job, and your history stays where it is. What changes is where you look at it. Instead of logging into a separate site and finding the right report, the numbers are on a screen you or your client already open every day.
For some platforms that means embedding the dashboard they already have. Plausible, Fathom, and Pirsch were built as one clean page from the start, and Conversion Bridge can show that page inside the WordPress admin. The same goes for Umami Cloud, PostHog, Swetrix, GoSquared, Usermaven, and Microsoft Clarity.
Google Analytics has nothing like that to embed. So for GA4, Conversion Bridge builds its own dashboard, pulling the data through the GA4 API and laying it out on one page you can read without a tutorial.
Whatever platform feeds it, a dashboard worth having shows you sessions over time, where your traffic came from, which pages get visited, what devices people use, and roughly where in the world they are. That's the standard set, and it's also where most dashboards stop, which is the reason a lot of people stop finding them useful.
Traffic Numbers Alone Don't Tell You Much
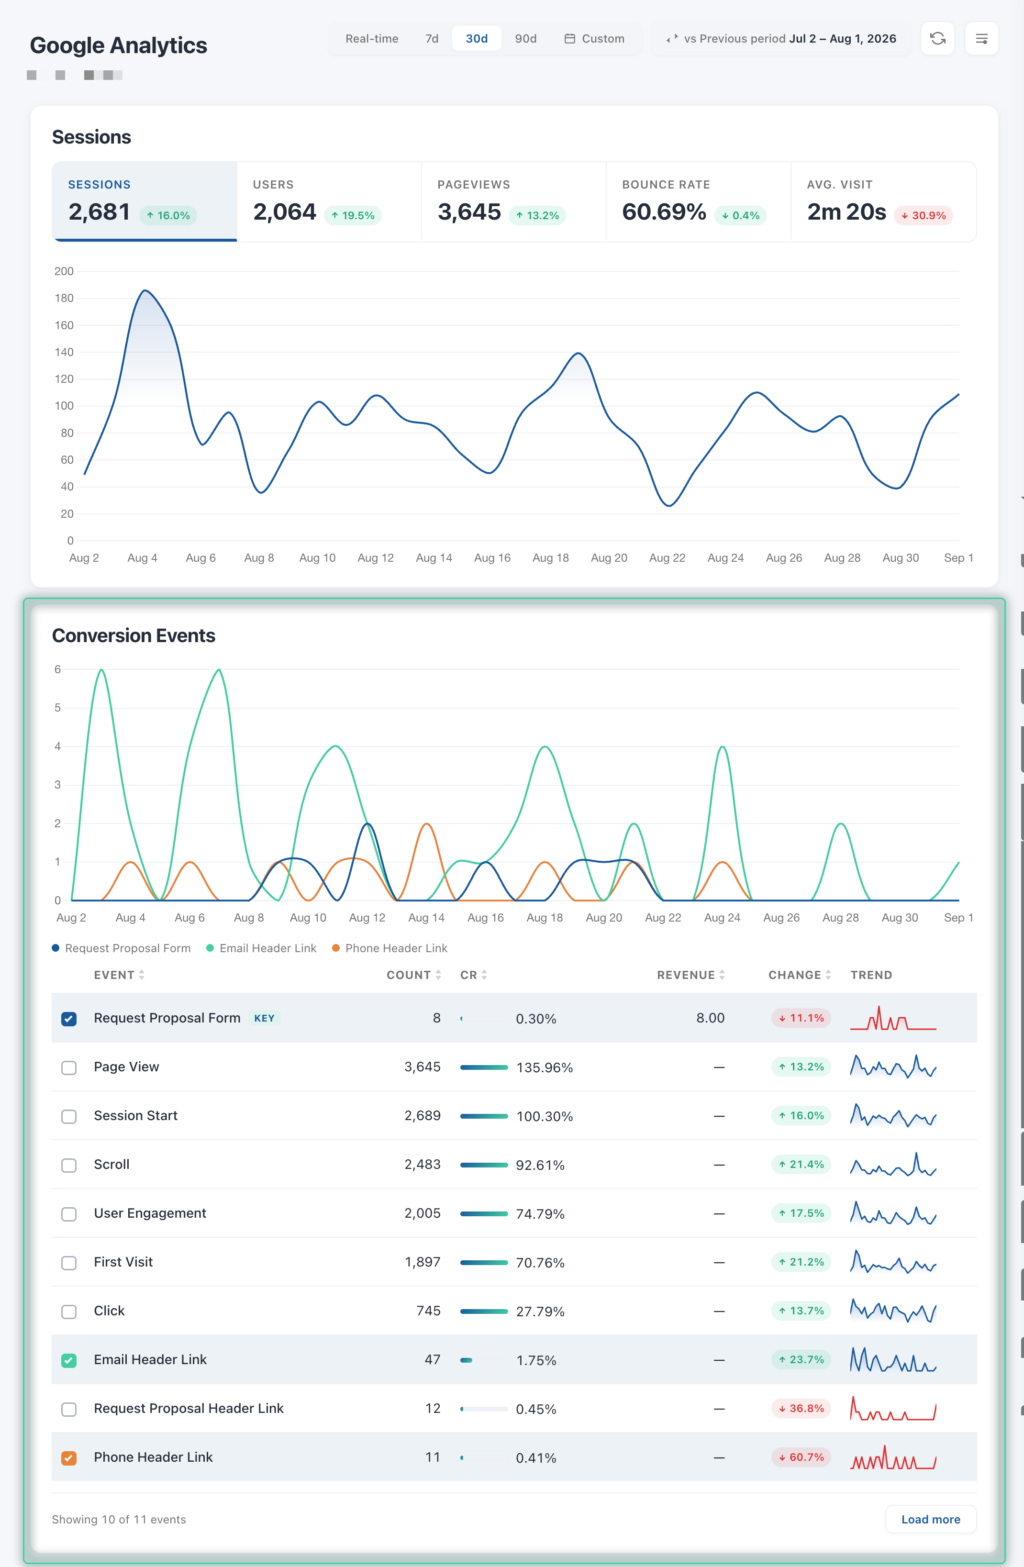
Sessions, pageviews, and bounce ratePercentage of visitors who leave a website after viewing only one page without interacting further. describe activity, not results. WordPress traffic analytics on their own tell you people came and nothing about what they did, so you can watch sessions climb for a month and have no idea whether any of those people bought anything, filled in a form, or signed up.
This gets worse with a client. Show someone a graph of sessions going up and they'll ask, reasonably, whether it means more business, and if the dashboard can't answer that, the graph was decoration.
A dashboard becomes useful when it shows conversions next to traffic, meaning the things you wanted visitors to do rather than the fact that they visited.
Conversion Data Next to Your Traffic
The piece worth looking for is conversion data, which shows what people actually did on your site: purchases, form submissions, signups, downloads, bookings.
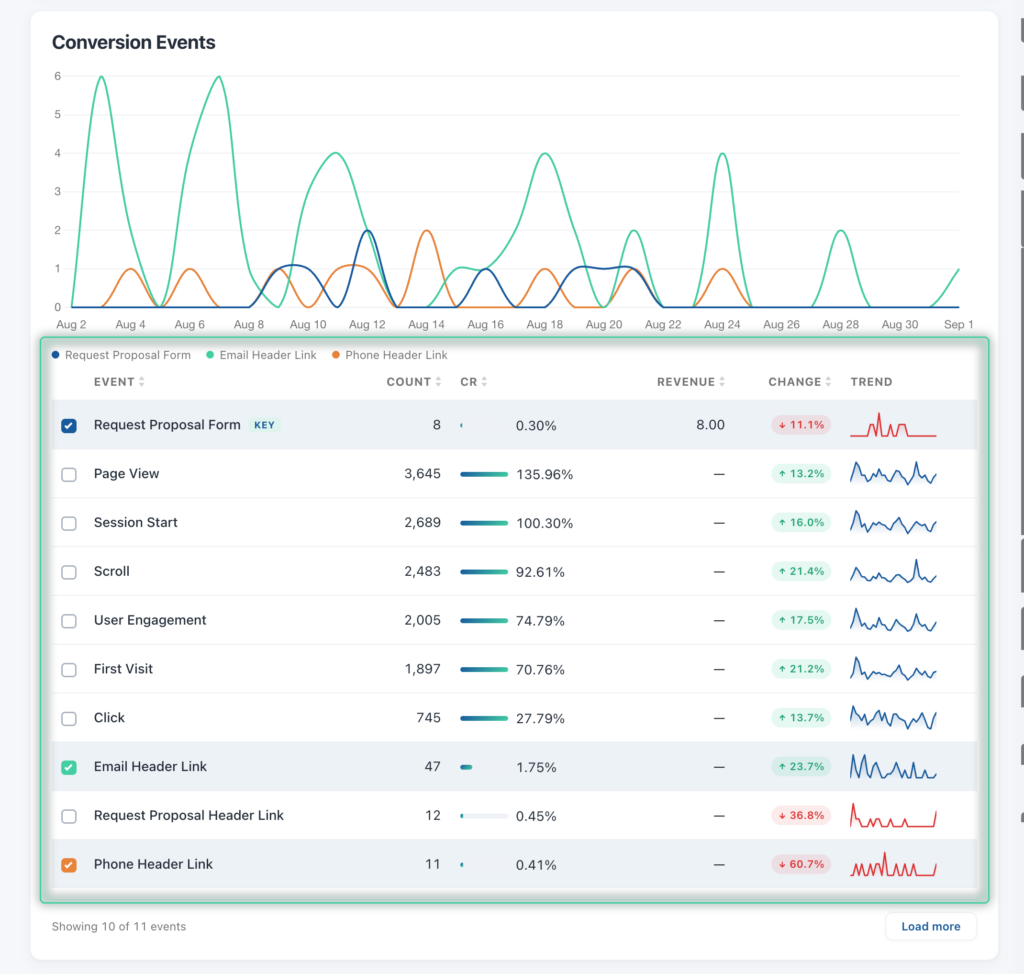
It tells you how effective the website is, not just how busy. A traffic chart says a month was busy. Conversion data says whether that busy month produced anything. Put the two together and you can read the site properly. Two thousand sessions with four form submissions points at a landing page problem, while the same two thousand sessions with eighty submissions says the traffic is doing its job. And if traffic goes down while conversions go up, you haven't lost anything. You have a better page. With each conversion's count, rate, and change against the previous period side by side, you can also see which kinds of conversions are growing and which have gone flat.
Filtering Everything by a Conversion
Once you know eighty people submitted a form, the next question is who they were and where they came from. That's where most dashboards stop being able to help.
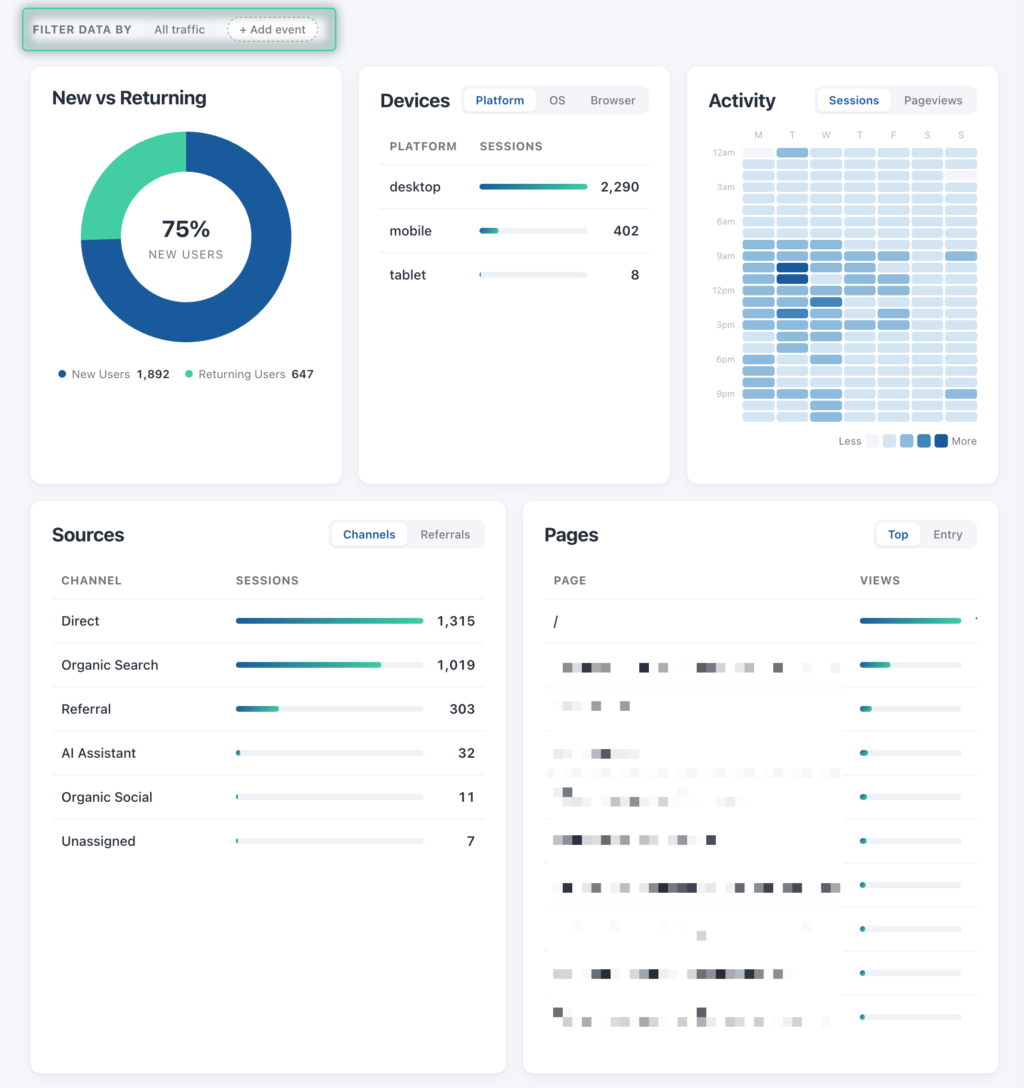
A dashboard that can filter by a conversion event answers it. Pick purchases, and your traffic sources become the sources that produced purchases, your pages become the pages buyers looked at, and countries, devices, and new versus returning all describe your customers instead of your visitors.
That's a different set of numbers than the default view, and often a surprising one. The source that sends the most traffic is regularly not the source that sends the most buyers, and you can't see that from a sessions chart no matter how long you look at it. In Google Analytics itself you'd build a complicated exploration with a segment to get there. On Conversion Bridge's dashboard it's one click on the filter bar.
Setting Up a Google Analytics Dashboard in WordPress
The dashboard itself is the quick part. What takes a little thought is making sure it has conversion data to show and that the right people can get to it, so it's worth doing these in order rather than switching the dashboard on first and wondering why it only shows traffic.
Start with conversion tracking. Decide what counts as a conversion on your site, whether that's a purchase, a form submission, a signup, or a booking, and get those sent to Google Analytics as events. That's what gives the dashboard something to show beyond traffic.
Then connect your Google Analytics account. The dashboard reads your data back through the GA4 API, so WordPress needs permission to do that. In Conversion Bridge that's a sign-in with Google, and once it's connected you turn the dashboard on with one setting.
Then decide who sees it. Pick which user roles get the Analytics menu, so the people who should be checking the numbers can get to them without an administrator account.
How Conversion Bridge Does It
Conversion Bridge's Google Analytics dashboard starts with sessions, users, pageviews, and bounce rate over time. Under that is the conversion events table with each event's count, rate, revenue, and change against the previous period, then your sources, pages, locations, devices, an activity heatmap, and your most recent conversions as they arrive. The filter bar sits between the events table and everything below it, every number can be compared against the previous period, month, quarter, or year, and any card you don't use can be switched off.
The conversion data comes from the tracking Conversion Bridge already does. It connects 71 WordPress plugins to Google Analytics, so form submissions, purchases, signups, and bookings are recorded as conversions without any code, and that's the conversion data the dashboard shows. The getting started guide covers the setup.
There's also an Overview report, a conversion dashboard that works from Conversion Bridge's own data rather than Google's, with every number compared against the period before it, for when you want the comparison without working it out yourself.
Frequently Asked Questions
Does a WordPress analytics dashboard slow down my site?
No. The dashboard runs in the admin, which your visitors never load. What affects front-end speed is the tracking script, and that's true whether or not you view the results inside WordPress.
Can clients see the dashboard without a full admin account?
Yes. In Conversion Bridge you choose which user roles can see the Analytics menu, so a client with an editor account can open the dashboard without administrator access to the site.
Do I still need Google Analytics if I have this?
Yes. The dashboard reads from your Google Analytics 4 property, so you need GA4 set up and connected in Conversion Bridge for it to exist at all. The dashboard is a view of that data inside WordPress. Google Analytics itself is still there for advanced marketers who know their way around it.
Why does my dashboard only show traffic and no conversions?
Almost always because conversion tracking was never set up. The dashboard can only display what's being collected, so tracked events have to exist first.