
You spend hours writing a helpful blog post. People read it. They learn something. Then they leave.
A week later, some of those same people come back. Maybe through Google again, maybe by typing your URL directly. This time, they buy something or fill out your contact form.
Your blog post did its job — it introduced people to your business and built trust. But in most analytics setups, that blog post gets zero credit for the sale. The conversion shows up on your checkout page or thank-you page. And you're left wondering whether your content is actually helping your business or just eating your time.
It's one of the most common frustrations I hear from WordPress site owners. The good news is there's a way to connect the dots — starting with Conversion Bridge's own built-in reports, and going deeper with post type filtering in your analytics platform.
What "Conversion-Driving Blog Posts" Really Means
A "conversion-driving blog post" doesn't mean someone reads it and immediately buys something (though that's nice when it happens). It means the post starts the journey toward a conversion.
The typical customer journey: 1. Someone searches Google for "best running shoes for beginners" 2. They find your blog post and read it 3. They browse around your site a bit, maybe look at a few products 4. They leave (most people do) 5. A few days later, they come back and buy running shoes
In this example, your blog post was the landing page — the first page they saw. The purchase happened on a different page. But your blog post deserves credit for bringing them in.
Landing page vs. conversion page: - Landing page: Where someone first arrives on your site during a visit - Conversion page: Where they complete an action (purchase, form submission, etc.)
The goal is to find which landing pages — specifically which blog posts — lead to the most conversions.
Why This Matters for Your Business
Understanding which content drives conversions isn't just interesting. It's essential for making good business decisions.
Stop guessing what works. Right now, you might be guessing which blog topics resonate with your audience. Wouldn't it be better to know that your post about "choosing the right running shoes" leads to 3x more sales than your post about "marathon training tips"?
Justify your content investment. Writing good content takes time. If you're paying someone to write blog posts (or spending your own valuable hours), you should know whether it's paying off. This data helps you prove the value of content marketing — or know when to change your approach.
Double down on what converts. When you find a blog post that consistently leads to sales, that's gold. You can: - Write more content on similar topics - Add stronger calls-to-action to that post - Promote it more heavily on social media - Link to it from other posts
Fix what doesn't convert. A blog post with lots of traffic but no conversions isn't necessarily bad. Maybe it just needs a clearer call-to-action. Or maybe the topic attracts people who aren't your ideal customers. Either way, you can't improve what you can't measure.
Make real decisions from real data. Instead of "I think our readers like posts about X," you can say "posts about X led to 47 conversions last month." That changes how you plan your content calendar, allocate your budget, and report results to stakeholders.
Start With Conversion Bridge's Built-In Reports
Before you open your analytics platform, check what's already waiting for you in WordPress. Conversion Bridge tracks conversions internally and ties them back to landing pages automatically.
Top Landing Pages
In your WordPress admin, go to Conversion Bridge → Tools → Top Landing Pages. This report shows which pages on your site drive the most conversions, ranked by count.
You can filter by: - Date range — last 7 days, 30 days, or a custom range - Event type — narrow to just purchases, form submissions, signups, or any other conversion type - AttributionThe process of determining which channels, campaigns, or actions contributed to a conversion, helping you understand what influenced a visitor’s decision to take action. model — first-touch (the page that started the session) or last-touch (the page visited right before the conversion)
If most of your blog posts are standard WordPress posts, they'll be easy to spot alongside your product and static pages. This report gives you a fast answer to "what's converting?" without leaving WordPress.
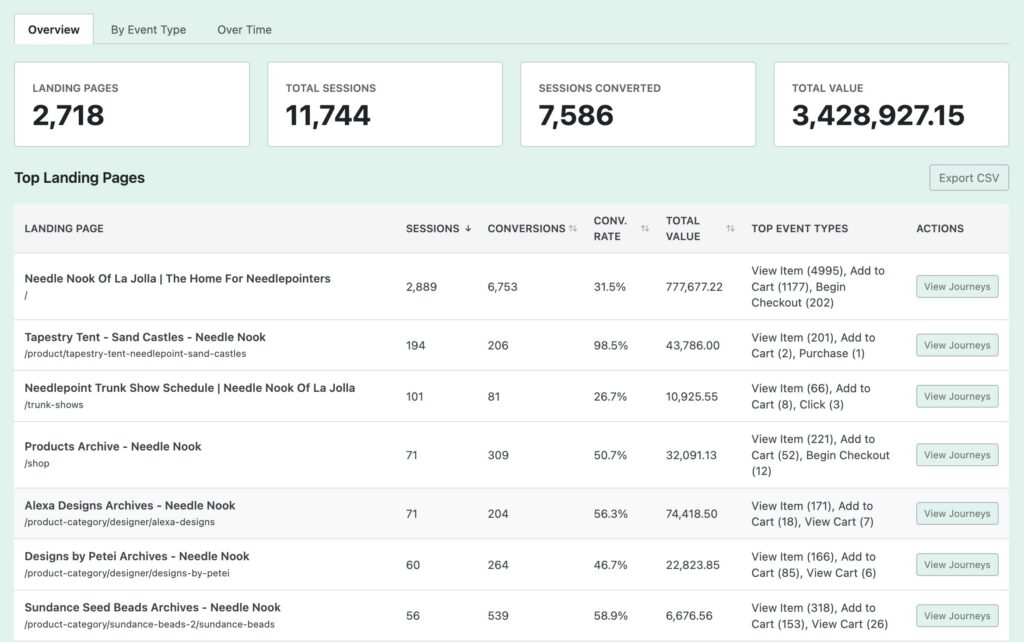
Top landing pages report in Conversion Bridge
Dashboard Widget
Your WordPress dashboard includes a Conversion Bridge widget that shows: - Conversion trends over the last 7 and 30 days - Your 10 most recent conversions - Your top converting landing pages
Use the event type dropdown to filter by specific conversion types. If you want to see which pages drive form submissions specifically, select that event and the widget updates.
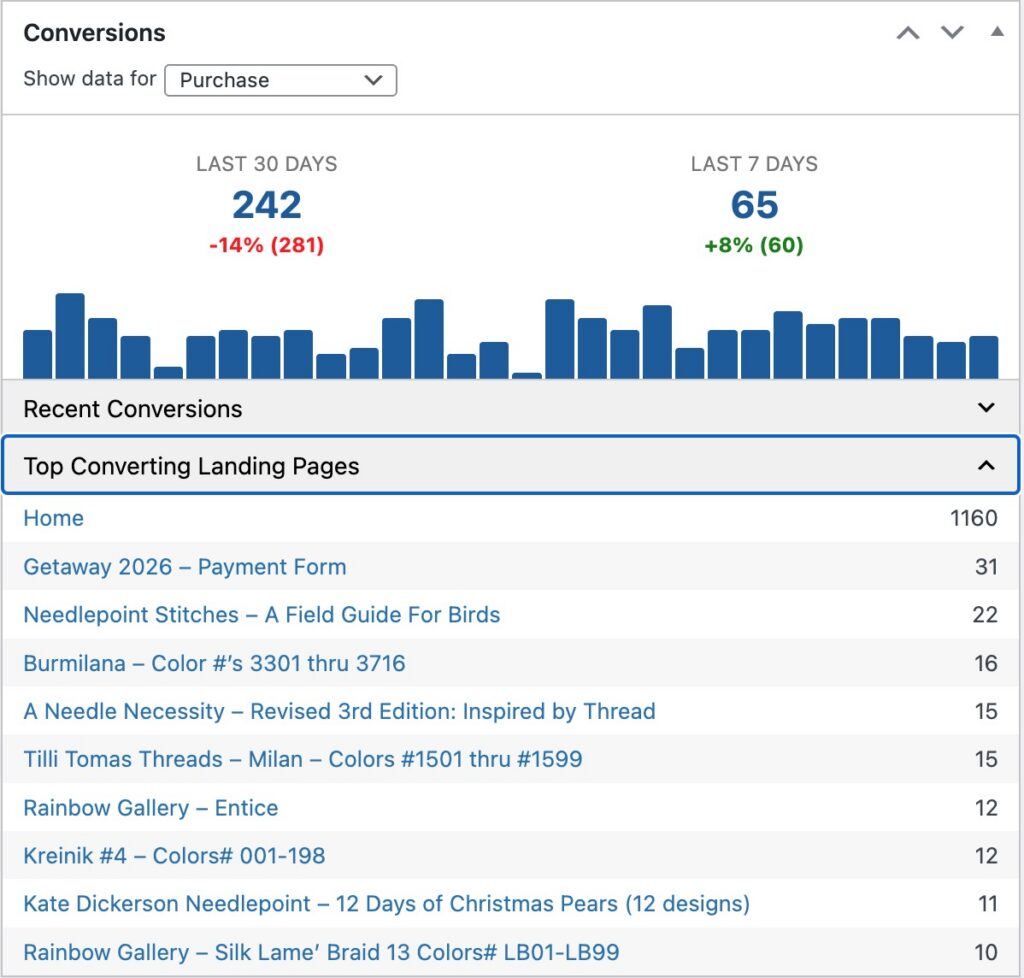
Dashboard widget with top landing pages
Conversion Journeys
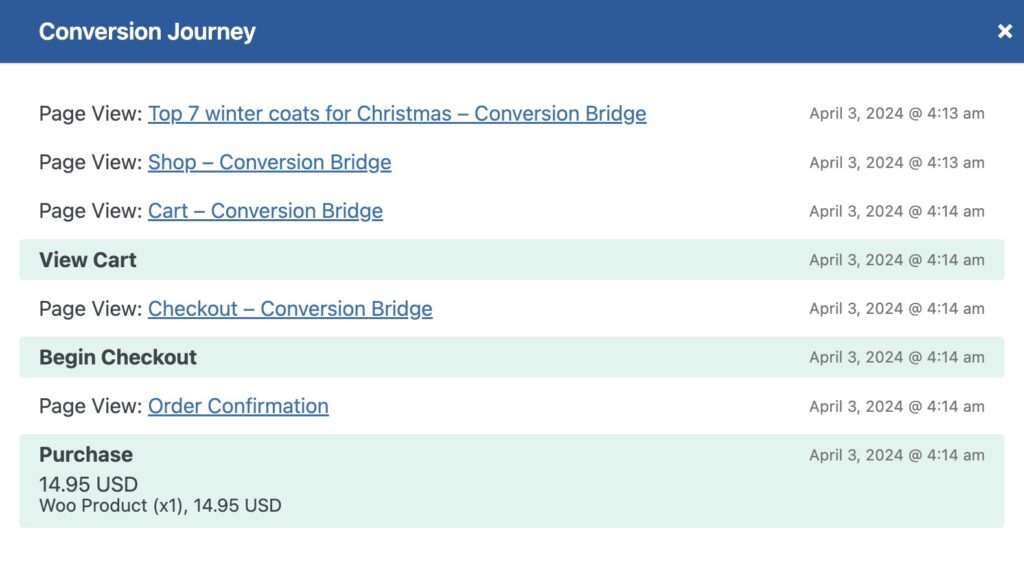
For a deeper look, go to Conversion Bridge → Journeys. This shows the page-by-page path visitors took before converting. You can filter by event type, date range, and UTM parametersUTM parameters are tags added to a link that show where traffic comes from and which campaigns lead to real conversions..
Where the Top Landing Pages report tells you which pages convert, journeys tell you how visitors got there. You might discover that people consistently read a specific blog post two or three pages before purchasing — even when that post wasn't the landing page.
Conversion Bridge also sends a conversion journey summary in your weekly email report, so you can track your top converting pages without logging in.
Weekly Email Reports
If you've enabled email reports in Conversion Bridge settings, you get a summary every Monday morning with your conversion stats, trends, and top landing pages from the past week. It's a good way to keep an eye on which content is performing without actively checking reports.
Going Deeper in Your Analytics Platform
Conversion Bridge's built-in reports answer the basics quickly. But your analytics platform can take the analysis further — segmenting by post type, comparing conversion rates across content categories, and building saved reports you can revisit over time.
The key feature that makes this work is Conversion Bridge's post type property. When enabled, it sends the WordPress post type (post, page, product, or any custom post type) with every page view. That lets you filter analytics reports to show only blog posts, only product pages, or any other content type.
Enable Post Type in Conversion Bridge
In your WordPress admin, go to Conversion Bridge → Settings, then open the settings for your analytics platform. Enable "Include extra properties" and check the Post Type option.
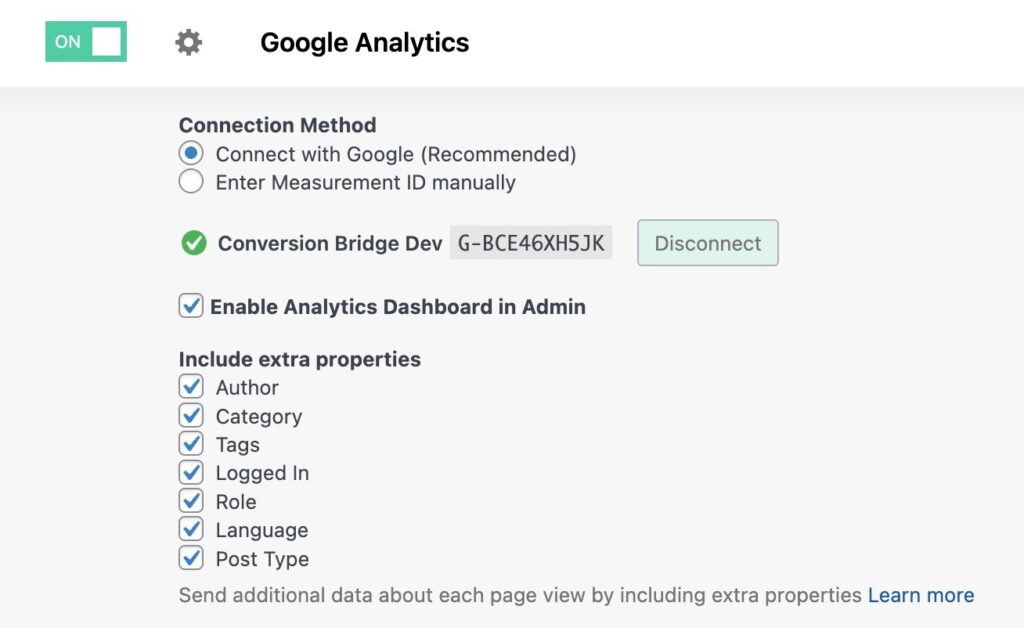
Conversion Bridge supports post type filtering on these platforms:
- Google Analytics 4
- Plausible Analytics
- PostHog
- Pirsch Analytics
- Google Tag Manager
- Microsoft Clarity
Each platform receives the same properties — author, category, tags, post type, and more. The filtering works the same way conceptually, though each platform's interface is different.
How Landing Pages Connect to Conversions
Most analytics platforms track sessions — one visit from start to finish. A session starts when someone arrives at your site and ends when they leave (or after a period of inactivity).
During a session, your platform tracks: - Which page they landed on first (the landing page) - Which pages they viewed - What actions they took - Whether they converted
Because your platform knows both the landing page and whether a conversion happened during that session, it can answer the question: "Of all the sessions that started on this blog post, how many resulted in a conversion?"
That means you can see things like:
- "Your post about running shoes started 500 sessions last month, and 23 of those sessions included a purchase."
- "Your post about marathon training started 800 sessions, but only 4 led to purchases."
Adding the post type filter narrows this to just blog posts — removing your homepage, product pages, and everything else from the results.
Give It Time
You'll need at least 2-4 weeks of traffic and conversions to see meaningful patterns. Analytics platforms only track going forward — they can't retroactively add post type data to older sessions. If you just enabled the property, give it time before drawing conclusions.
Finding Top Blog Posts in GA4
GA4's Explore feature gives you full control over dimensions, metrics, and filters — which is exactly what you need for this analysis.
Why Explore instead of the standard Landing Page report? GA4's built-in Landing Page report (Reports → Engagement → Landing page) mixes all page types together and doesn't let you easily filter by post type. Explore gives you that flexibility.
Step 1: Open GA4 and go to Explore
Log into your Google Analytics account at analytics.google.com. Select your property if you have multiple.
In the left sidebar, click Explore.
Step 2: Create a new exploration
Click the Blank template to start fresh. (You can also use "Free form" if you see that option.)
You'll see a workspace with: - Variables on the left (dimensions and metrics to choose from) - Tab Settings in the middle (how to configure your report) - The report area on the right (where your data will appear)
Step 3: Add your dimensions
Dimensions are the things you want to group your data by. You need two:
Add "Landing page": 1. In the Variables panel, click the + next to "Dimensions" 2. Search for "Landing page" 3. Check the box next to "Landing page" (not "Landing page + query string") 4. Click Import
Add "Post type": 1. Click the + next to "Dimensions" again 2. Search for "Post type" (this is the custom dimension from Conversion Bridge) 3. Check the box and click Import
Now drag both dimensions to the Rows area in Tab Settings.
Step 4: Add your metrics
Add "Sessions": 1. In the Variables panel, click the + next to "Metrics" 2. Search for "Sessions" 3. Check the box and click Import
Add "Key events": 1. Click + again 2. Search for "Key events" (this is what GA4 calls conversions) 3. Check the box and click Import
Drag both metrics to the Values area in Tab Settings.
A note about specific conversion types: The "Key events" metric shows ALL your conversions combined. If you want to see just one type (like only purchases), you can add an additional filter for that event name. See the "Compare Different Conversion Types" section below.
Step 5: Filter to show only blog posts
This is the step that makes everything work.
- In Tab Settings, find the Filters section
- Click to add a filter
- Set it up as:
- Dimension: Post type
- Match type: exactly matches
- Value: post
- Click Apply
Now your report will only show pages where post type equals "post" — just your blog posts.
Step 6: Sort by conversions
Click on the Key events column header to sort from highest to lowest. Now you can see your blog posts ranked by how many conversions they helped generate.
Step 7: Interpret your results
You should see a table showing: - Landing page: The URL of each blog post - Post type: Should all say "post" (thanks to your filter) - Sessions: How many visits started on this post - Key events: How many of those visits led to a conversion
What to look for: - Posts with high conversions = Your winners. These are driving business results. - Posts with lots of sessions but few conversions = Opportunity. Maybe add better CTAs. - Posts with few sessions but good conversions = Hidden gems. Promote these more.
GA4 Path Exploration
GA4 also offers Path Exploration, which shows the actual pages visitors viewed before converting. This is useful when you want to see the full journey, not just where it started.
- In GA4, go to Explore
- Choose the Path exploration template
- Click Start over to clear the default setup
- Click the Ending point box
- Select Events → choose your key event (like
purchaseorform_submit) - GA4 will show you the pages users visited leading up to that event
Path Exploration doesn't support post type filtering, so you'll see all page types mixed together. But it's a good complement to the Free-form report when you want to understand the full journey.
Finding Top Blog Posts in Other Platforms
The concept is the same across every platform that supports post type: find a report that shows landing pages, filter to post type = "post", and look at which ones lead to conversions. The interface is just different.
Plausible Analytics
Plausible supports custom properties, which is how Conversion Bridge sends post type data.
- In your Plausible dashboard, click Filter
- Select the Post type property
- Set it to post
- Your dashboard now shows only blog post traffic
Plausible's dashboard will update to show pageviews, visitors, and goal conversions filtered to just your blog content. If you've configured goals in Plausible, you can see which blog posts lead to the most conversions directly from this filtered view.
PostHog
PostHog receives post type as a "super-property" on every event. To filter to blog posts:
- Go to Web Analytics or create a new Insight
- Add a filter for the
post_typeproperty - Set it to
post - Break down by page URL to see which blog posts drive the most conversions
PostHog's funnelRepresents the step-by-step process users take before completing a conversion, such as making a purchase or signing up. and path analysis tools also let you trace how visitors move from blog posts to conversion events, similar to GA4's Path Exploration.
Pirsch Analytics
Pirsch supports custom event metadata, including post type from Conversion Bridge.
- Open your Pirsch dashboard
- Use the filter options to segment by the post type property
- Set it to
postto isolate blog content - Review your page-level data to see which posts drive the most goal completions
Conversion Bridge supports 19 analytics platforms including privacy-focused options like Plausible, Fathom, and Pirsch. See all supported platforms.
Comparing Different Conversion Types
Not all conversions are equal. A purchase is different from a newsletter signup. A contact form submission might be more valuable than a download.
In Conversion Bridge's built-in reports, you can filter by event type using the dropdown — select "purchase" to see only purchase-driving landing pages, or "form_submit" for form submissions.
In your analytics platform, the approach depends on the tool:
In GA4: Add a second filter in your Explore report for Event name (e.g., purchase, form_submit, generate_lead, sign_up). Save separate reports for each conversion type — "Blog Posts → Purchases," "Blog Posts → Form Submissions," etc.
In Other Platforms: Filter by goal in addition to the post type property to see which blog posts drive specific conversion types.
You might discover interesting patterns. Some posts are great for sales but don't generate many email signups. Some bring in lots of leads but few direct purchases. Both can be valuable — a post that builds your email list gives you subscribers to nurture, while a post that drives direct sales has immediate ROIA broad measure of how much profit or value you gain from a specific investment, like a website, plugin, or marketing campaign.. Understanding the difference helps you set realistic expectations for each piece of content.
Turn Insights Into Action
Data is only useful if you act on it.
For your top-performing posts (high conversions):
Add more calls-to-action. If a post is driving conversions, make it easier for visitors to take action. Add a relevant CTAA prompt that encourages users to take a specific action, such as clicking a button, submitting a form, or making a purchase. in the middle of the post, not just at the end.
Add internal links. Link from your other blog posts to your high-performers. Help visitors find your best content.
Update and expand. Keep these posts fresh. Add new information, update outdated sections, and make sure they're the best resource available on the topic.
Promote externally. Share these posts on social media. Consider running ads to them. They've proven they can convert visitors.
For high-traffic, low-conversion posts:
Improve the call-to-action. Maybe the CTA isn't compelling or isn't visible enough. Test different approaches.
Check topic relevance. Does this post attract your target customers, or random visitors who will never buy? If the traffic isn't relevant, the post might need refocusing.
Add conversion opportunities. Maybe there's no natural next step for readers. Can you offer a relevant download, guide, or resource?
For low-traffic, high-conversion posts:
These are hidden gems. They convert well but not many people see them.
Promote them. Share on social media, link from other posts, consider paid promotion.
Optimize for search. These posts clearly resonate with buyers. Improve their SEO to get more organic traffic.
For new content ideas:
Write more about topics that convert. If your "running shoes for beginners" post drives sales, consider: - "Running shoes for flat feet" - "Running shoes vs. walking shoes" - "How to know when to replace your running shoes"
Look at the questions your converting posts answer. What problems do they solve? Create more content that addresses related problems.
Common Mistakes to Avoid
A few pitfalls I see people run into:
Expecting instant results
If you just enabled post type tracking today, you won't have useful data yet. Analytics platforms only track going forward — they can't retroactively add post type to old sessions.
Wait at least 2-4 weeks before drawing conclusions. More data = more reliable insights.
Forgetting to enable Post Type in settings
Double-check that "Post Type" is actually enabled in Conversion Bridge's settings for your platform. The tracking code needs to be sending this data for the filter to work in your analytics reports.
Comparing posts with vastly different traffic levels
A post with 10,000 sessions and 50 conversions (0.5% rate) isn't worse than a post with 100 sessions and 3 conversions (3% rate). The second post might just be new or on a niche topic.
Consider both the raw numbers AND the conversion rateImproves website performance by increasing the percentage of visitors who complete desired actions, such as purchases, sign-ups, or form submissions. when evaluating posts.
Ignoring the full customer journey
The landing page is just where the journey started. A blog post might introduce someone to your brand, and they might convert on a later visit.
Landing page reports show sessions where the landing and conversion happen in the same visit. For longer sales cycles, the true impact of your content might be even higher. Conversion Bridge's journey tracking can help fill in those gaps.
Not taking action
The biggest mistake is looking at the data once and never doing anything with it.
Set a recurring reminder to check these reports monthly. Look for trends. Act on what you learn. That's how data becomes growth.
Getting Started
Start with Conversion Bridge's Top Landing Pages report in WordPress — it's the fastest way to see which content converts. When you want to dig deeper, enable the post type property for your analytics platform and build the filtered reports described above.
Whether you're using GA4, Plausible, PostHog, Pirsch, or any other supported platform, the core question is the same: which blog posts bring in visitors who convert? Once you can answer that, you can write more of what works and fix what doesn't.