UTM Reports Tool
The UTM Reports tool is a powerful analytics feature in Conversion Bridge that helps you understand which marketing channels, campaigns, and content variations are driving conversions on your website. By analyzing UTM (Urchin Tracking Module) parameters attached to your marketing links, you can gain deep insights into your marketing performance and make data-driven decisions about where to invest your marketing budget.
What Are UTM Parameters?
UTM parameters are tags you add to URLs to track where your website traffic originates. They consist of five main parameters:
- utm_source: Identifies which site sent the traffic (e.g.,
google,facebook,newsletter) - utm_medium: Identifies what type of link was used (e.g.,
email,cpc,social,organic) - utm_campaign: Identifies a specific product promotion or strategic campaign (e.g.,
spring_sale,product_launch) - utm_term: Identifies search keywords (primarily used for paid search campaigns)
- utm_content: Identifies what specifically was clicked to bring the user to the site (e.g.,
logolink,textlink,banner_ad)
Why UTM Reports Are Important
Marketing Attribution
Understanding which marketing efforts actually lead to conversions is crucial for optimizing your marketing spend. Without UTM tracking, you can't tell if a conversion came from a Facebook ad, an email campaign, or a Google search.
ROI Measurement
By tracking conversions back to specific campaigns and sources, you can calculate the true return on investment (ROI) for each marketing channel. This helps you:
- Identify your most profitable marketing channels
- Cut spending on underperforming campaigns
- Scale successful campaigns
Campaign Optimization
UTM reports reveal which campaigns, ad variations, and content pieces perform best, allowing you to:
- Double down on what works
- Improve or eliminate what doesn't
- Test new variations with confidence
Multi-Touch Attribution
The tool supports both first-touch and last-touch attribution models, giving you flexibility in how you credit conversions. This is essential for understanding the full customer journey.
Getting Started
Accessing the Tool
- Navigate to Settings → Conversion Bridge in your WordPress admin
- Click on the Tools tab
- Select UTM Reports from the tools list
Prerequisites
Before you can use UTM Reports, you need:
- UTM-tagged links directing traffic to your website
- Conversion events being tracked by Conversion Bridge
- At least one conversion event with UTM data
If you haven't set up UTM tracking yet, the tool will display a helpful message with links to:
- Learn about UTM tracking
- Use the UTM Generator tool within Conversion Bridge to create your first UTM-tagged link
Understanding Attribution Models
The UTM Reports tool supports two attribution models, which determine how conversions are credited to UTM parameters:
First-Touch Attribution
What it does: Credits the conversion to the first UTM-tagged pageview in a user's session.
When to use it:
- You want to understand which channels are best at acquiring new customers
- You're focused on top-of-funnel marketing activities
- You want to measure awareness campaigns
Example: A user clicks a Facebook ad (first touch), browses your site, then returns later via a Google search (last touch) and converts. With first-touch attribution, the conversion is credited to Facebook.
Last-Touch Attribution
What it does: Credits the conversion to the most recent UTM-tagged pageview before the conversion event.
When to use it:
- You want to understand which channels are best at closing sales
- You're focused on bottom-of-funnel marketing activities
- You want to measure conversion-focused campaigns
Example: Using the same scenario above, with last-touch attribution, the conversion is credited to Google.
Using the Filters
The UTM Reports tool includes powerful filtering options at the top of the interface:

Date Range
- After: Select the start date for your analysis
- Before: Select the end date for your analysis
- Default: The tool defaults to the last 30 days
- Limitation: The date picker will only allow dates from your earliest recorded event
Attribution Model
Toggle between First Touch and Last Touch attribution models using the radio buttons. The report will automatically refresh when you change this setting.
Applying Filters
- Select your desired date range
- Choose your attribution model
- Click Apply Filters to update the report
- Click Reset to return to default settings (last 30 days, first-touch attribution)
Note: Changing the report type (via the navigation tabs) preserves your filter settings, allowing you to analyze the same date range and attribution model across different report views.
Report Types
The UTM Reports tool offers nine different report views, each providing unique insights:
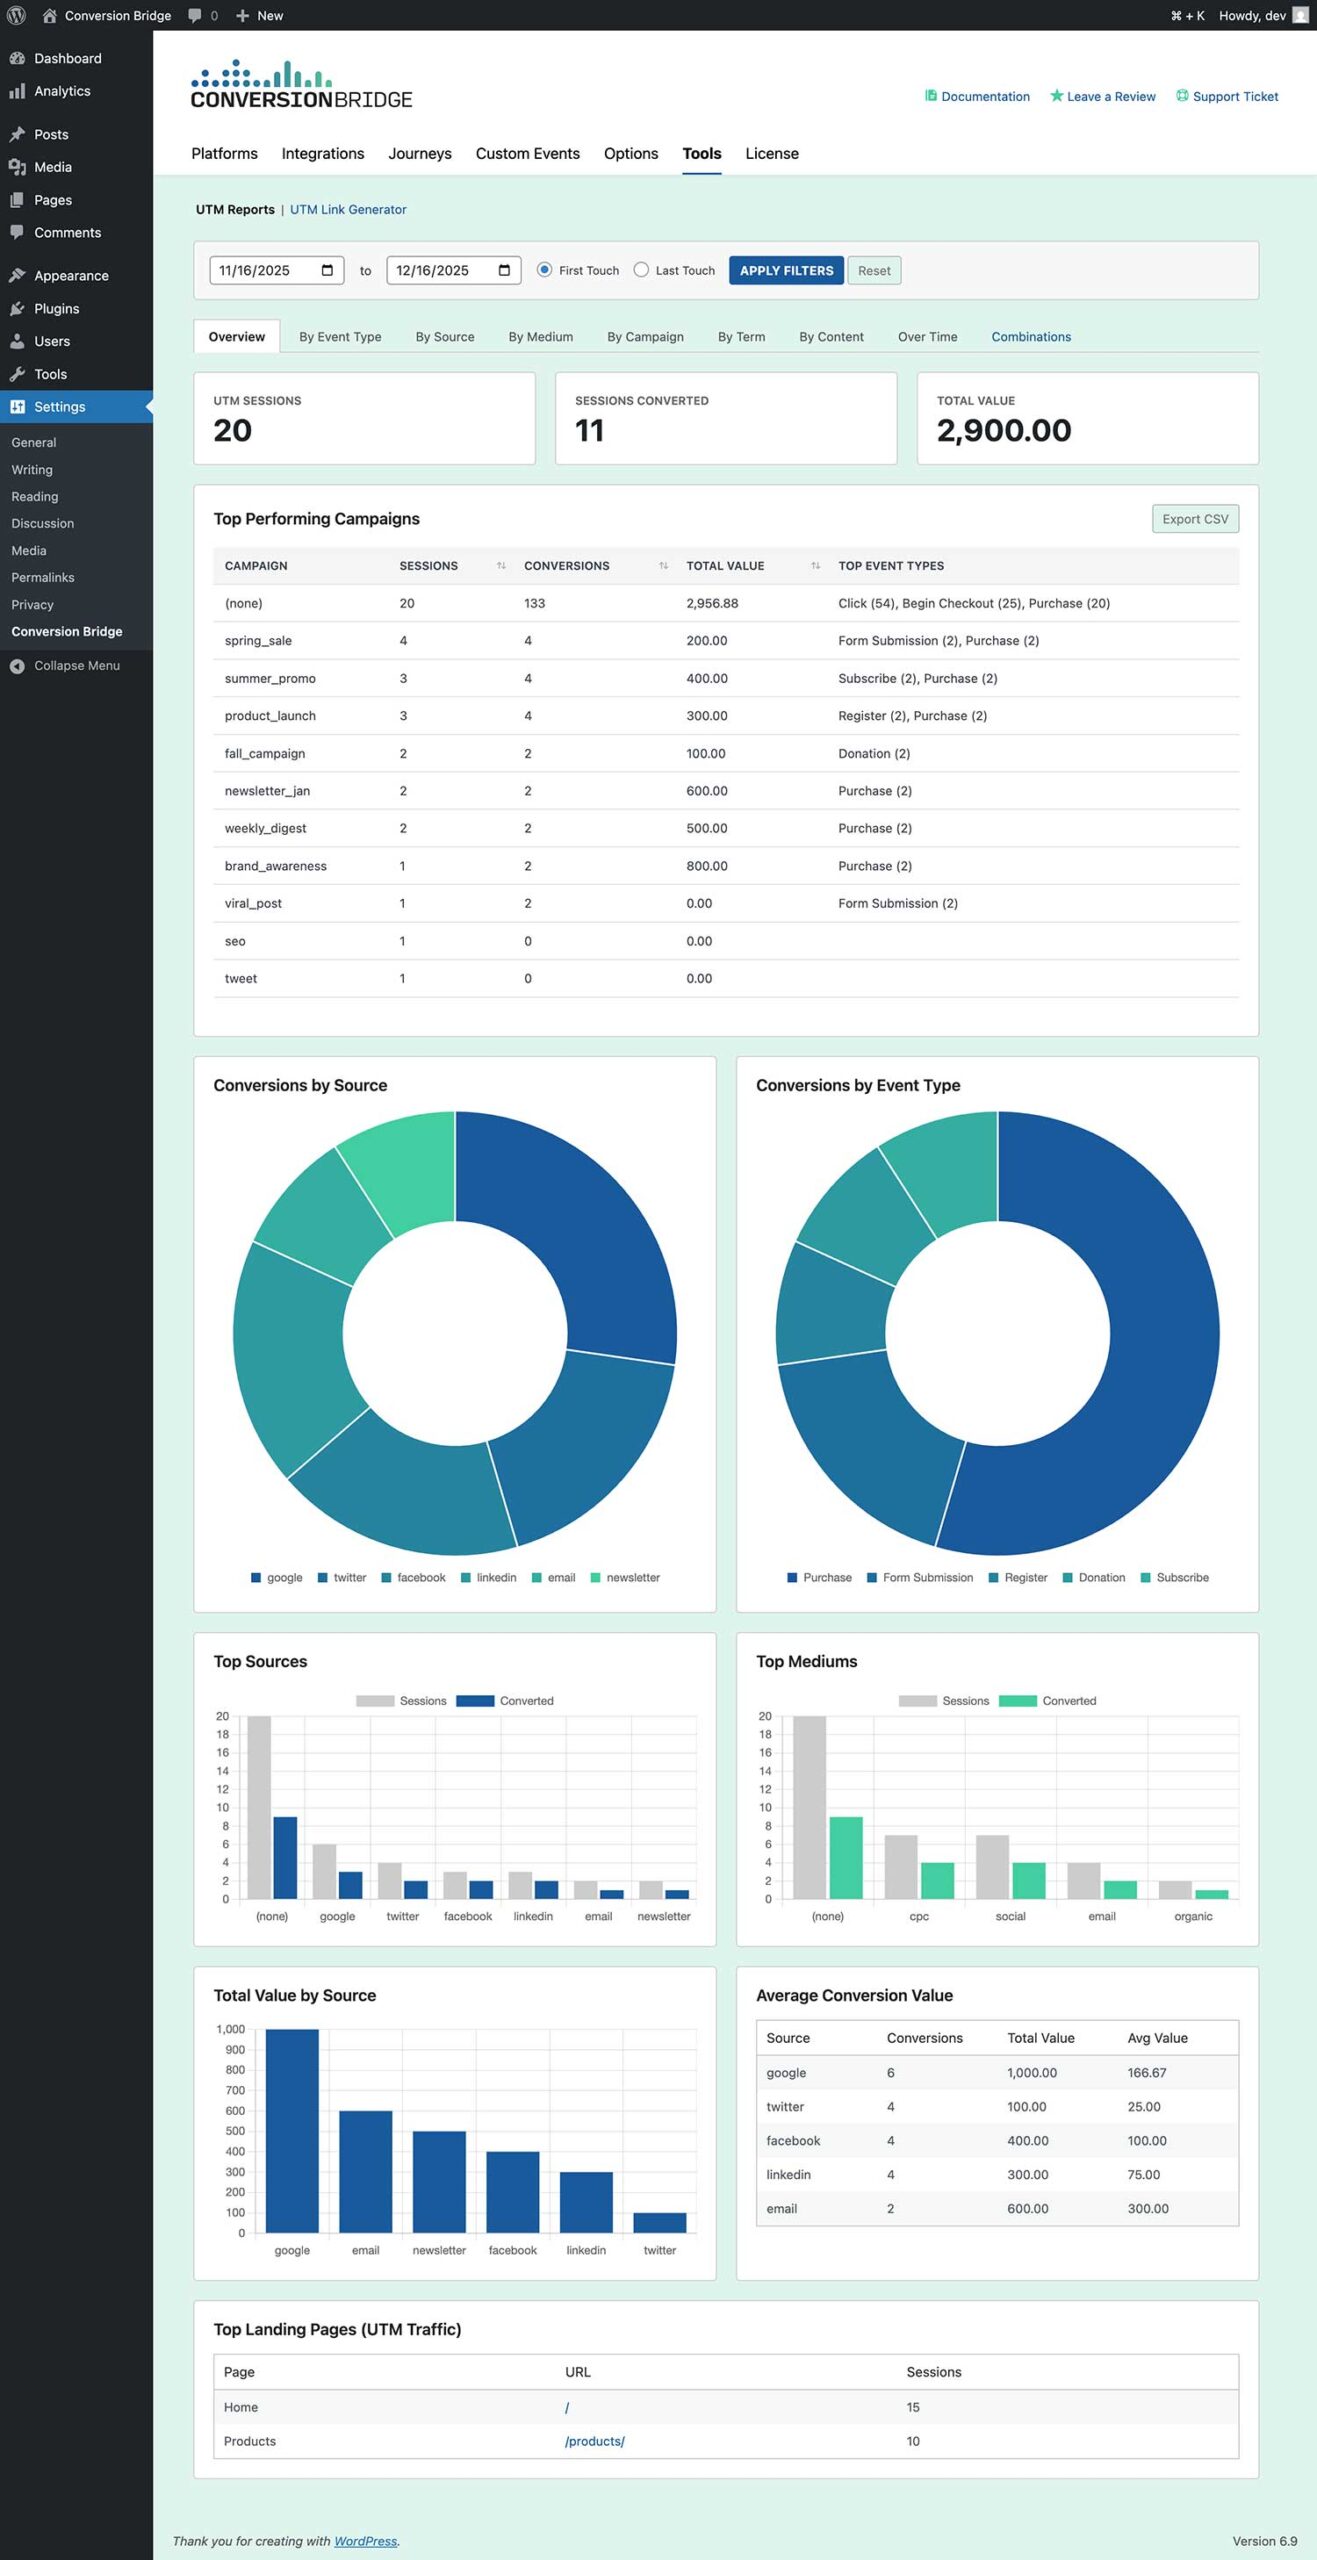
Overview Report
The Overview report provides a comprehensive dashboard with key metrics and visualizations.
Key Metrics Displayed:
- UTM Sessions: Total number of sessions that included UTM-tagged traffic
- Sessions Converted: Number of unique sessions that resulted in at least one conversion
- Total Value: Sum of all conversion values from UTM-attributed conversions
Visualizations:
- Top Performing Campaigns Table: Sortable table showing campaigns ranked by conversions
- Conversions by Source (Doughnut Chart): Visual breakdown of conversions by traffic source
- Conversions by Event Type (Doughnut Chart): Shows which types of conversion events are most common
- Top Sources (Bar Chart): Dual-bar chart comparing total sessions vs. converting sessions by source
- Top Mediums (Bar Chart): Dual-bar chart comparing total sessions vs. converting sessions by medium
- Total Value by Source (Bar Chart): Shows which sources generate the most revenue
- Average Conversion Value Table: Table showing average value per conversion by source
- Top Landing Pages: Table showing which pages UTM traffic lands on most frequently
How to Use:
- Start here for a high-level view of your marketing performance
- Use the conversion rate (conversions ÷ sessions) to identify your most effective sources
- Compare total value to identify your most profitable channels
- Review top landing pages to understand user entry points
By Event Type Report
This report shows how different UTM parameters perform across different conversion event types.
Features:
- Interactive Chart: Bar chart showing conversion counts
- Grouping Options: Toggle between viewing by Source, Medium, Campaign, Term, or Content
- Cross-Tabulation Table: Detailed table showing event type breakdowns for each UTM parameter value
- CSV Export: Export the full cross-tabulation data

How to Use:
- Identify which UTM parameters drive specific types of conversions
- Compare performance across different event types
- Export data for deeper analysis in spreadsheet software
- Use the sortable table to find top performers in each category
By Source Report
Analyzes performance grouped by traffic source (utm_source parameter).
Features:
- Bar Chart: Visual representation of conversions by source
- Detailed Metrics Table: Includes:
- Source name
- Total sessions
- Number of conversions
- Total conversion value
- Top event types for each source
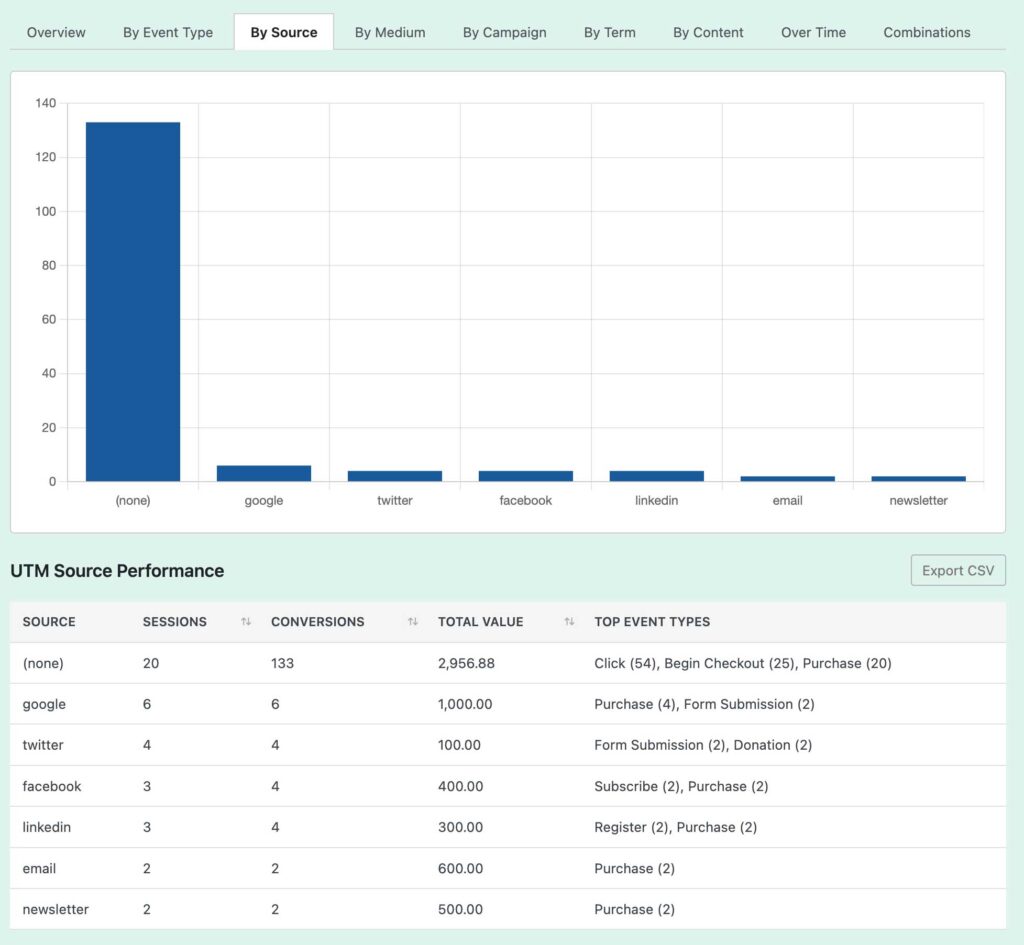
How to Use:
- Identify which traffic sources (Google, Facebook, email, etc.) drive the most conversions
- Compare conversion rates between sources
- Understand which sources generate the highest value conversions
- Use the sortable columns to rank sources by any metric
By Medium Report
Analyzes performance grouped by traffic medium (utm_medium parameter).
Features:
- Bar Chart: Visual representation of conversions by medium
- Detailed Metrics Table: Same structure as the Source report
Common Medium Values:
email: Email marketing campaignscpc: Cost-per-click advertising (Google Ads, etc.)social: Social media postsorganic: Organic social sharesreferral: Referral trafficaffiliate: Affiliate marketing
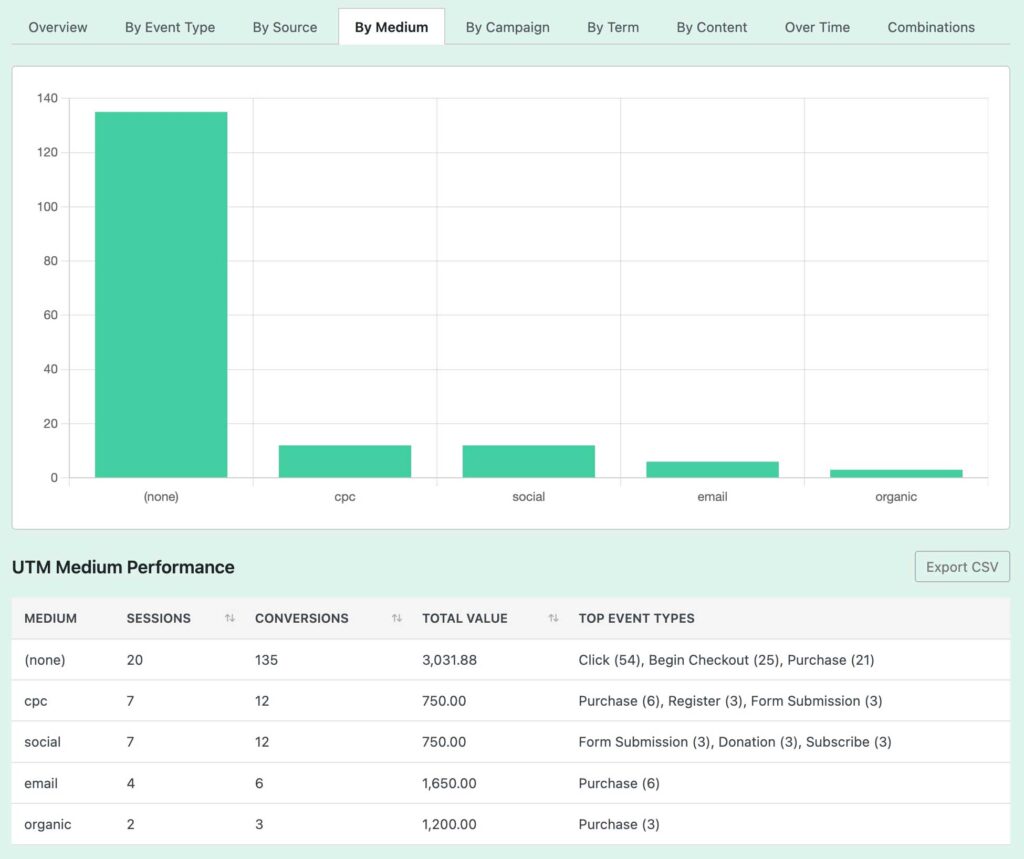
How to Use:
- Understand which marketing mediums are most effective
- Compare paid vs. organic performance
- Identify opportunities to expand successful mediums
By Campaign Report
Analyzes performance grouped by campaign name (utm_campaign parameter).
Features:
- Bar Chart: Shows top 15 campaigns by conversions
- Detailed Metrics Table: Full breakdown of all campaigns
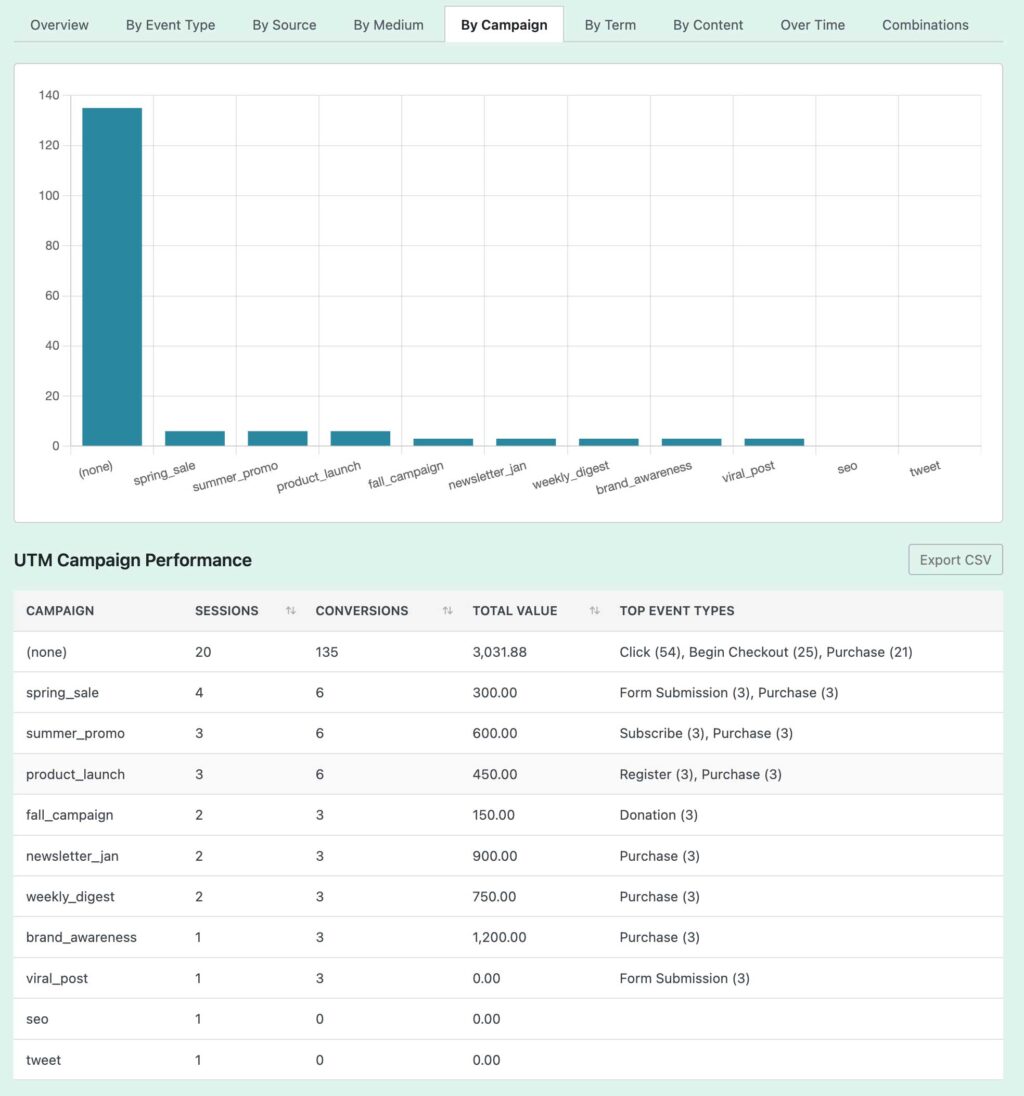
How to Use:
- Measure the success of specific marketing campaigns
- Compare campaign performance over time
- Identify winning campaign strategies to replicate
- Calculate campaign ROI by comparing campaign costs to conversion values
By Term Report
Analyzes performance grouped by search terms (utm_term parameter), primarily used for paid search campaigns.
Features:
- Bar Chart: Visual representation of conversions by term
- Detailed Metrics Table: Full term performance data
Note: This report will show "No term data found" if you're not using utm_term in your UTM links. This is normal for non-search campaigns.
How to Use:
- Identify which keywords drive conversions in paid search
- Optimize keyword bidding based on conversion performance
- Discover new keyword opportunities
By Content Report
Analyzes performance grouped by content variation (utm_content parameter), used to test different ad variations or link placements.
Features:
- Bar Chart: Visual representation of conversions by content variation
- Detailed Metrics Table: Full content performance data
Common Use Cases:
- A/B testing different ad creatives
- Comparing performance of different CTA buttons
- Testing banner ad placements
How to Use:
- Identify winning ad variations and content
- Optimize creative elements based on performance data
- Scale successful content variations
Over Time Report
Shows how conversions trend over time, broken down by UTM parameters.
Features:
- Line Chart: Multi-line chart showing top 5 performers in each category over time
- Grouping Options: Toggle between Source, Medium, Campaign, Term, or Content
- Daily Granularity: Data is broken down by day
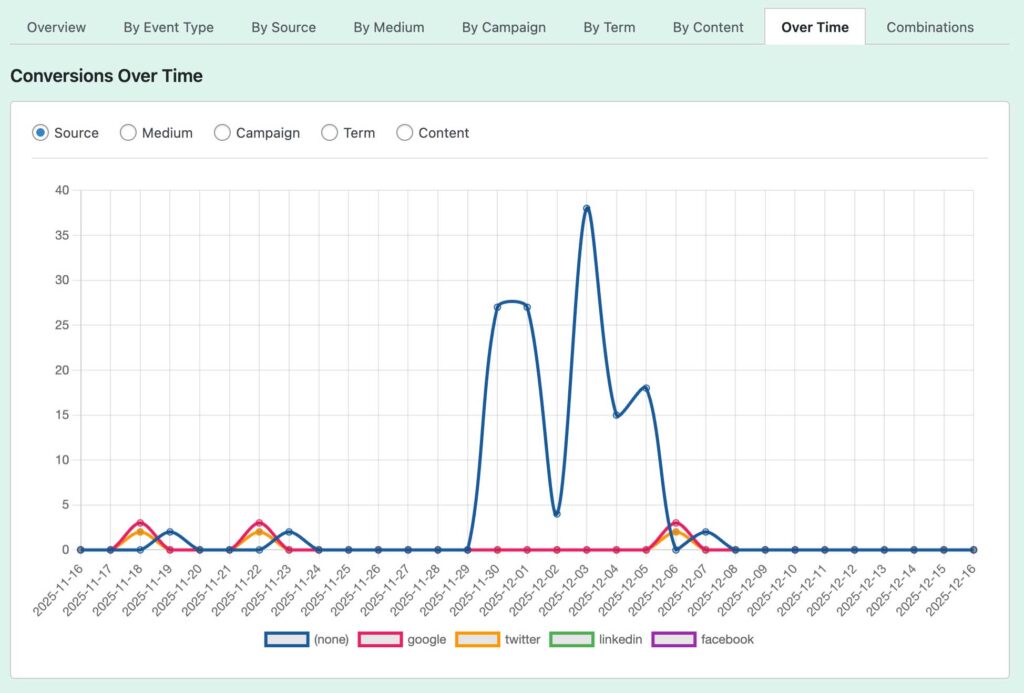
How to Use:
- Identify trends and patterns in conversion performance
- Spot seasonal variations
- Compare performance trajectories between different UTM parameters
- Identify when campaigns peak or decline
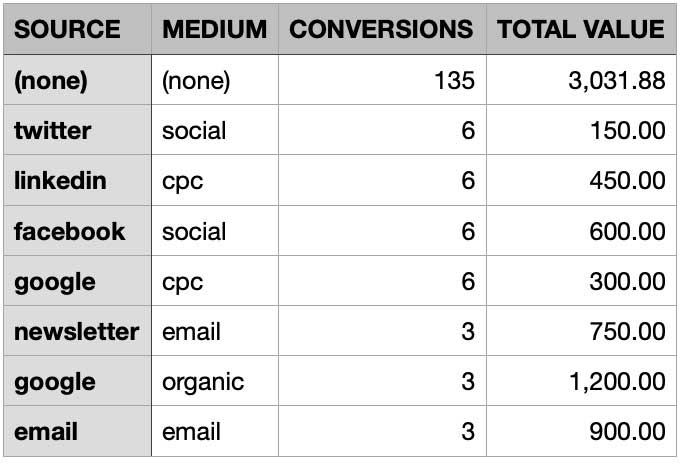
Combinations Report
Shows performance of Source + Medium combinations, which is often the most meaningful way to analyze traffic.
Features:
- Sortable Table: Shows Source, Medium, Conversions, and Total Value
- CSV Export: Export combination data for analysis
- Sorted by Conversions: Automatically sorted by conversion count (descending)
Why It's Important: A source like "google" could come from organic search, paid ads, or email. The combination of source + medium (e.g., "google / cpc") provides much more actionable insights.

How to Use:
- Identify your best-performing traffic source/medium combinations
- Understand the full context of where traffic originates
- Make informed decisions about where to invest marketing budget
- Export data for deeper analysis or reporting
Understanding the Metrics
Sessions
Definition: A session is a period of user activity on your website. Sessions with UTM data are those where the user arrived via a UTM-tagged link.
What to Look For:
- High session counts indicate good traffic volume
- Compare sessions to conversions to calculate conversion rates
- Use total sessions to understand reach, and converting sessions to understand effectiveness
Conversions
Definition: The number of conversion events attributed to a UTM parameter based on your selected attribution model.
What to Look For:
- Higher is generally better, but consider conversion rates too
- Compare conversions across different UTM parameters to identify winners
- Look at the "Top Event Types" column to understand what types of conversions each parameter drives
Conversion Rate
Calculation: (Converting Sessions ÷ Total Sessions) × 100
What to Look For:
- Higher conversion rates indicate more effective marketing
- A source with fewer sessions but higher conversion rate might be more valuable than one with many sessions but low conversion rate
- Use conversion rates to optimize your marketing mix
Total Value
Definition: The sum of all conversion values for conversions attributed to a UTM parameter.
What to Look For:
- Higher total value indicates more revenue generated
- Compare total value to marketing spend to calculate ROI
- Consider both volume (conversions) and value when making decisions
Average Value
Calculation: Total Value ÷ Conversions
What to Look For:
- Higher average value indicates higher-quality conversions
- A source with fewer conversions but higher average value might be more profitable
- Use average value to identify sources that attract high-value customers
Interpreting the Data
Identifying Top Performers
- Look at Multiple Metrics: Don't rely on just one metric. A source with high conversions but low value might not be as valuable as one with fewer conversions but higher value.
- Calculate Conversion Rates: Divide converting sessions by total sessions to see which sources are most effective at converting visitors.
- Consider ROI: If you have marketing spend data, compare it to total value to identify your most profitable channels.
Spotting Opportunities
- High Sessions, Low Conversions: These sources have good reach but may need optimization. Consider:
- Improving landing page experience
- Adjusting messaging to match visitor expectations
- Testing different offers or CTAs
- Low Sessions, High Conversion Rate: These are highly effective but underutilized. Consider:
- Increasing budget or effort in these channels
- Scaling successful campaigns
- Replicating what works in other channels
- High Value, Low Volume: These sources attract high-value customers. Consider:
- Creating similar campaigns
- Targeting similar audiences
- Understanding what makes these sources valuable
Understanding Attribution Differences
When switching between first-touch and last-touch attribution:
- First-touch will typically show higher values for awareness channels (social media, content marketing)
- Last-touch will typically show higher values for conversion-focused channels (paid search, retargeting)
Compare both models to understand the full customer journey and give appropriate credit to both acquisition and conversion efforts.
Exporting Data
Most reports include CSV export functionality, allowing you to:
- Perform Deeper Analysis: Import data into Excel, Google Sheets, or other tools for advanced calculations
- Create Custom Reports: Build reports tailored to your specific needs
- Share with Stakeholders: Export data for presentations or team reviews
- Historical Tracking: Save exports to track performance over time
How to Export:
- Navigate to any report that includes an "Export CSV" button
- Click the button
- A CSV file will download with the current report data
- Open in your preferred spreadsheet application
Best Practices
Consistent UTM Naming
Use a consistent naming convention for your UTM parameters:
- Sources: Use lowercase, no spaces (e.g.,
facebook,google,newsletter) - Mediums: Use standard values (e.g.,
email,cpc,social,organic) - Campaigns: Use descriptive, consistent names (e.g.,
spring_sale_2024,product_launch_q1)
Regular Monitoring
- Review UTM reports weekly or monthly
- Set up regular exports for historical tracking
- Compare performance across time periods
Test and Iterate
- Use utm_content to test different ad variations
- Compare performance and scale what works
- Continuously optimize based on data
Combine with Other Metrics
- Don't rely solely on UTM reports
- Combine with cost data to calculate ROI
- Consider customer lifetime value, not just initial conversion value
- Look at other Conversion Bridge reports for complete picture
Attribution Model Selection
- Use first-touch for understanding acquisition and awareness
- Use last-touch for understanding conversion and closing
- Consider reviewing both models to understand the full funnel
- Align attribution model with your marketing goals
Date Range Selection
- Use consistent date ranges for comparisons (e.g., always last 30 days)
- Consider seasonality when analyzing data
- Compare similar time periods year-over-year for accurate trends
Troubleshooting
No Data Showing
Possible Causes:
- No UTM-tagged links: You need to add UTM parameters to your marketing links
- No conversions: Ensure conversion events are being tracked
- Date range too narrow: Expand your date range
- Wrong attribution model: Try switching between first-touch and last-touch
Solutions:
- Use the UTM Generator tool to create properly tagged links
- Verify conversion tracking is working
- Check that events are being recorded in Conversion Bridge
Data Looks Incorrect
Possible Causes:
- Inconsistent UTM naming: Typos or variations in UTM values create separate entries
- Attribution model confusion: Remember that attribution affects how conversions are credited
- Date/timezone issues: Ensure your WordPress timezone is set correctly
Solutions:
- Standardize your UTM parameter values
- Review your UTM link generation process
- Check WordPress timezone settings
Performance Issues
If reports load slowly:
- The tool uses caching (15 minutes) to improve performance
- Large date ranges may take longer to process
- Use the "Refresh" parameter in the URL (
?refresh=1) to force a cache refresh if data seems stale
Still need help?
If you have not yet found your answer in the documentation articles, please contact support
Contact support